Radar widget
Radar Chart
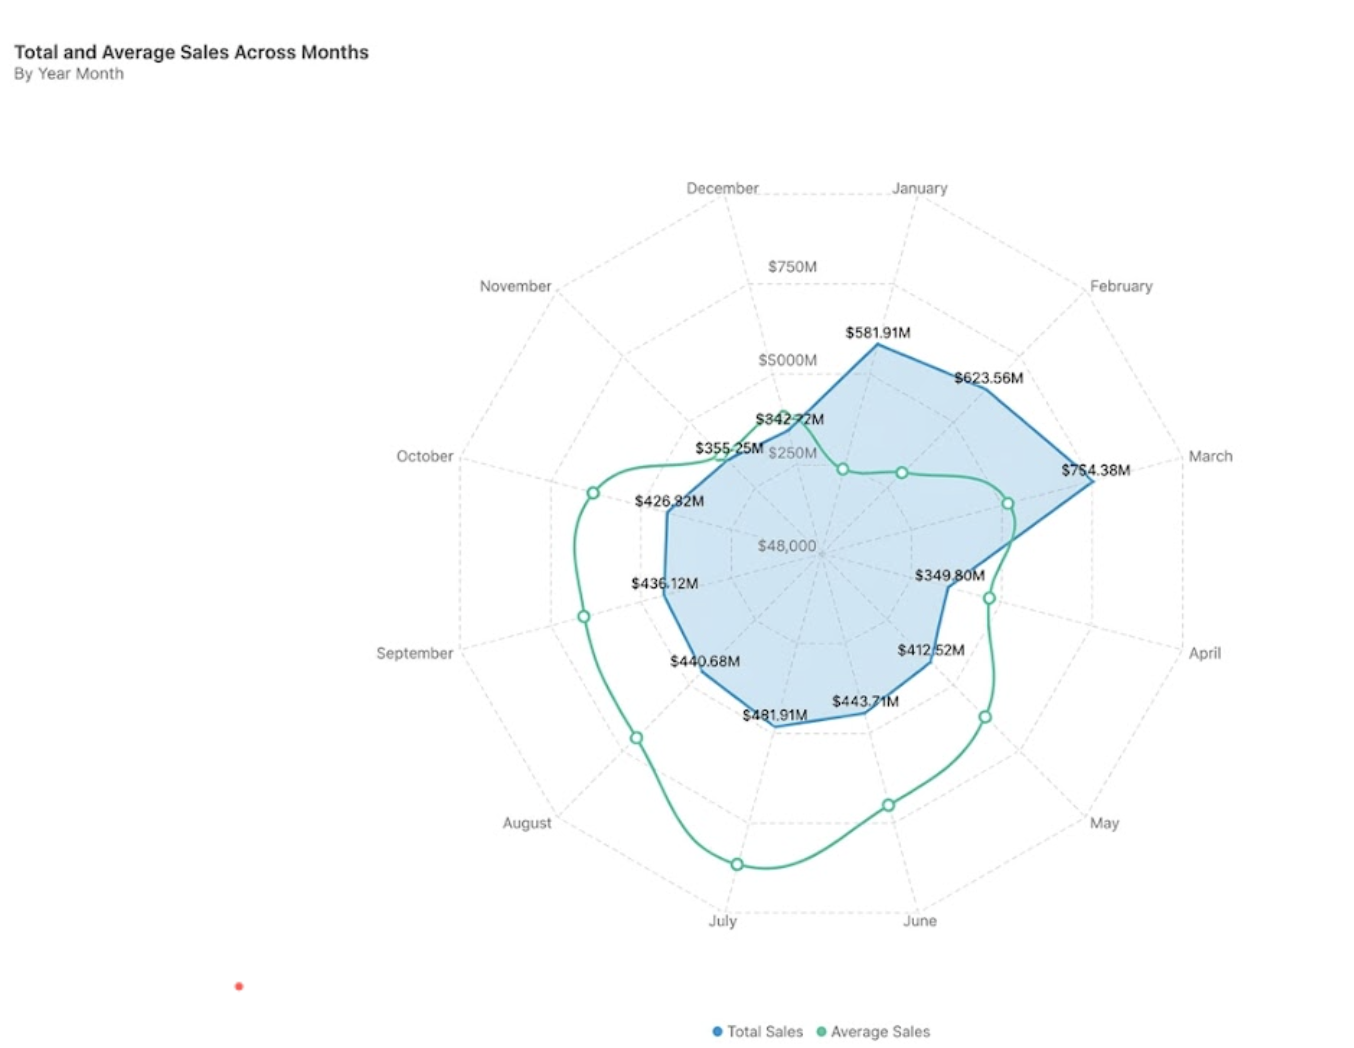
The Radar Chart (spider/web chart) plots data points across multiple axes radiating from a center, making it easy to compare two or more series across several dimensions simultaneously.
When to use: Overlaying metrics across months to spot seasonal patterns, comparing performance profiles across KPIs, or identifying imbalances at a glance.
How to create:
- Open the dashboard editor and add or edit a widget.
- Select your data columns and choose Radar from the Visualization panel.
- Configure using one of the two layouts below.
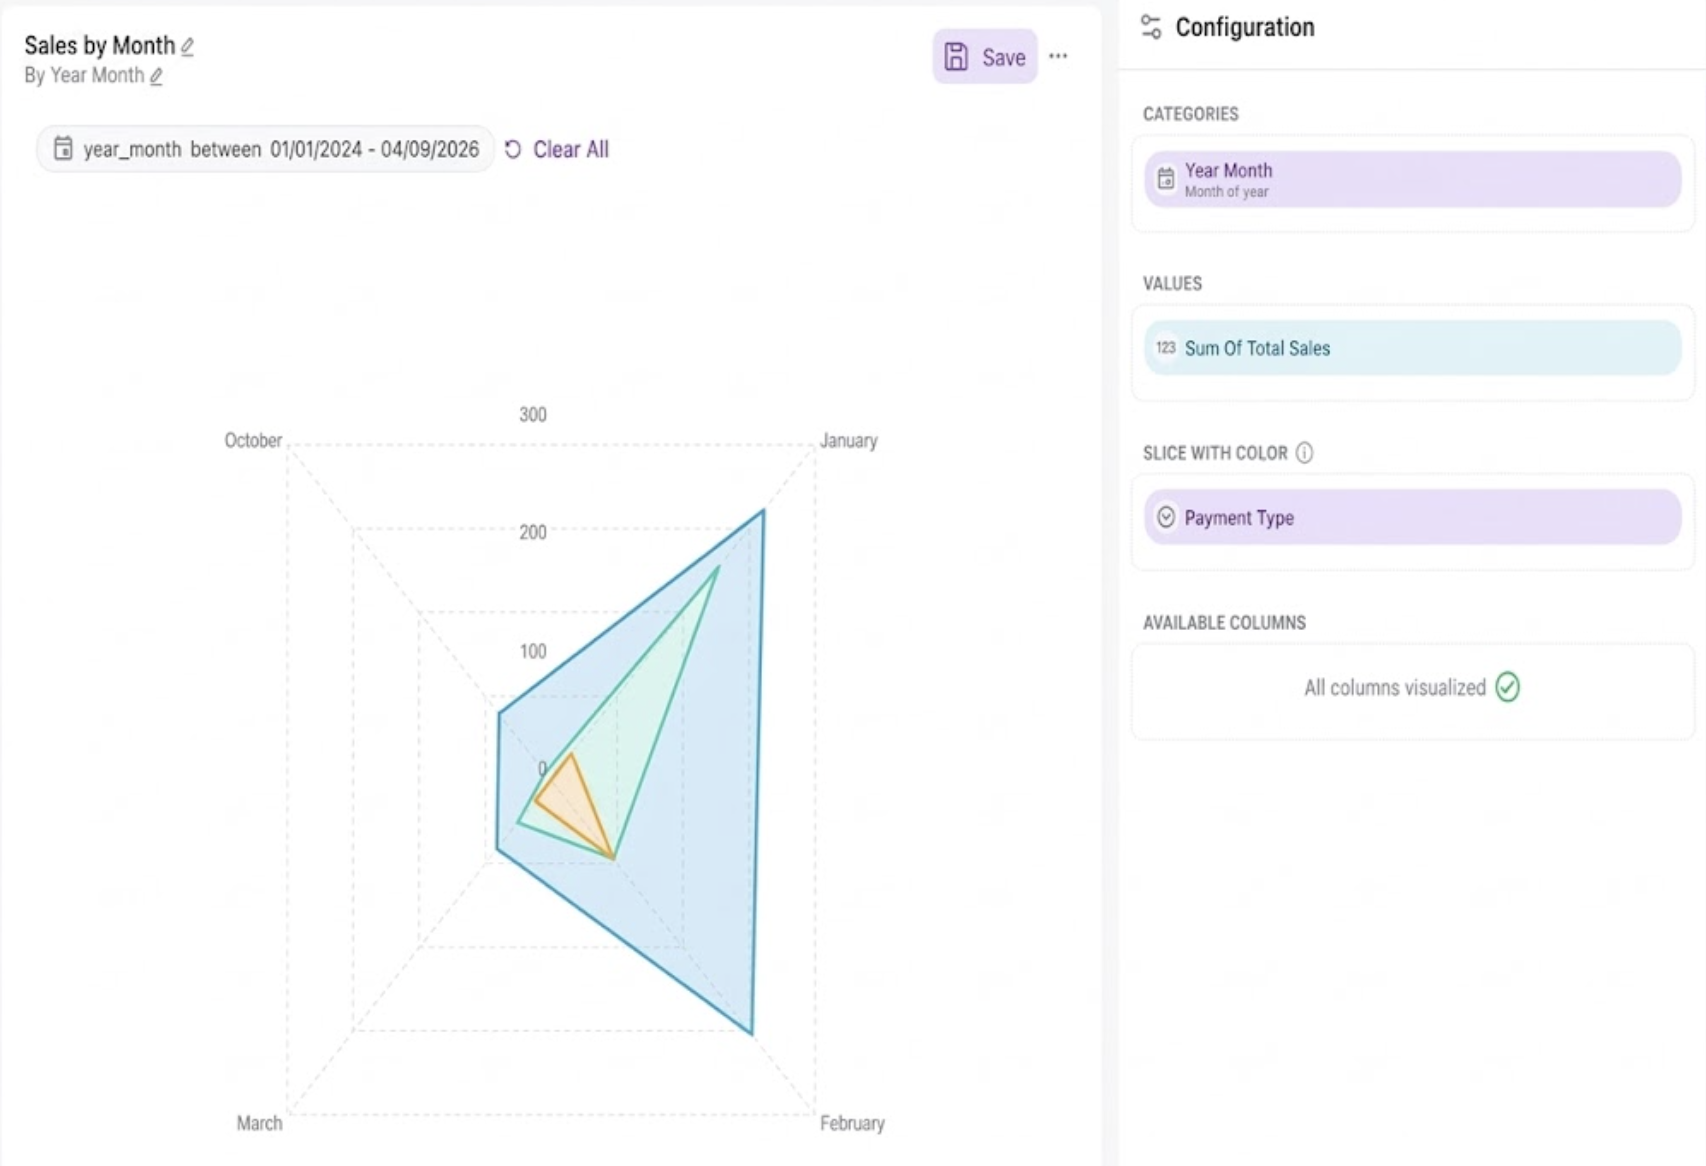
Configuration A — Two Dimensions, One Metric
Use one dimension as the category axis, one metric as the value, and a second dimension in the Slice with Color field to create separate polygon layers per group.
| Field | Example |
|---|---|
| Categories | Year Month (Month of Year) |
| Values | Sum of Total Sales |
| Slice with Color | Payment Type |
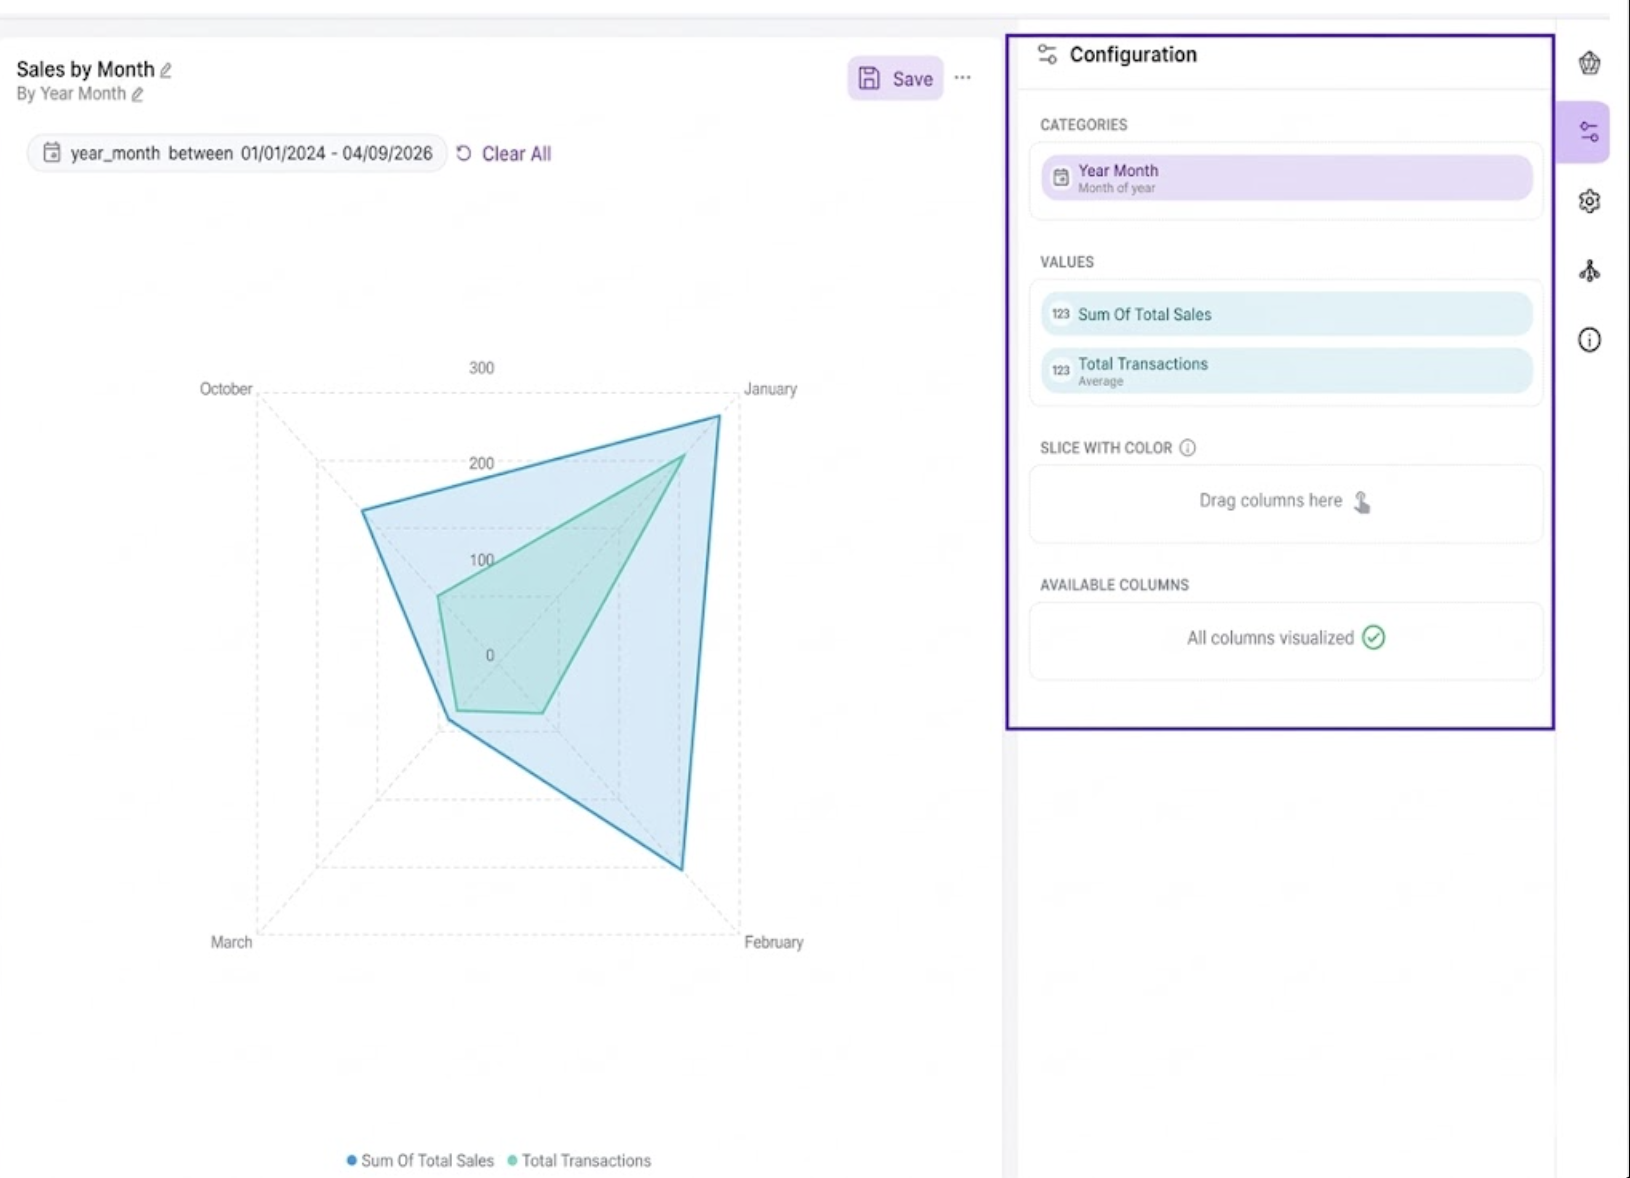
Configuration B — One Dimension, Multiple Metrics
Use a single dimension as the category axis and add multiple metrics to the Values field. Each metric generates its own polygon — useful for comparing KPIs on the same time axis.
| Field | Example |
|---|---|
| Categories | Year Month (Month of Year) |
| Values | Sum of Total Sales, Total Transactions (Average) |
| Slice with Color | (leave empty) |
Changing chart type per series: When using multiple metrics, each series can be rendered independently as an Area or Line. Open the Configuration panel, click the metric name, and change the Chart Type dropdown. You can also adjust Display Title, Numeric Notations, Decimal Points, Color, and Chart Data Labels per series.
Tip: Use no more than 12 axes on a radar chart. Beyond that, labels overlap and the chart becomes difficult to read.
Was this helpful?